A few days after my post on The Chinese Coal Monster was published I received an email from Jean Laherrere with the following charts and some comments:
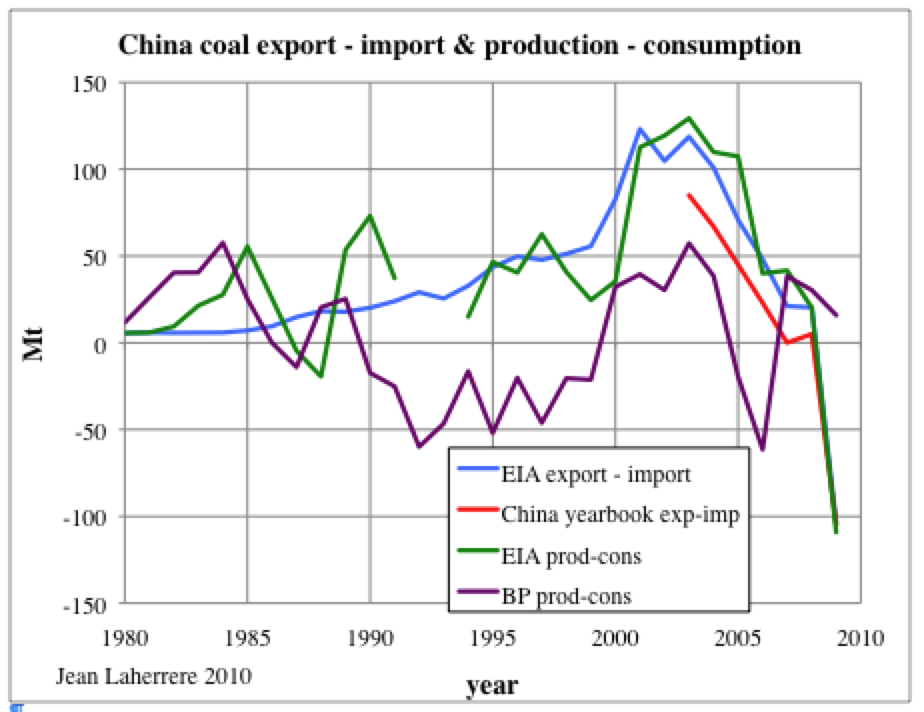
One of the puzzles addressed in the original post was the fact that BP data showed Chinese production and consumption to be broadly in balance making it difficult to explain reports of surging coal imports.
Jean’s main point is that EIA data provides a different picture to that provided by BP and that the BP data are likely wrong.
It is very important to know that China is importing much more than in the past. In the above graph, with EIA data, it is a cliff, while BP data show a plateau. JL
The EIA and China year book figures show China plunging from net exporter (positive numbers) to net importer (negative numbers) of coal.
Jean points to BP figures as follows: production 3050 Metric Tonnes (Mt), consumption 3020 Mt, export balance 30 Mt. But using EIA figures: production 3539 Mt, consumption 3649 Mt, import balance 110 Mt. (note EIA report short tons converted to metric tonnes here).
The EIA data are similar to figures quoted in the National Bureau of Statistics of China and are therefore more likely to be correct than the BP figures that are based on data from The World Energy Council. The 500 Mt per annum difference between the two data sources is in itself worrying. The fact that one data source (EIA) shows net coal imports whilst BP data show Chinese production and consumption in balance is further cause for concern.
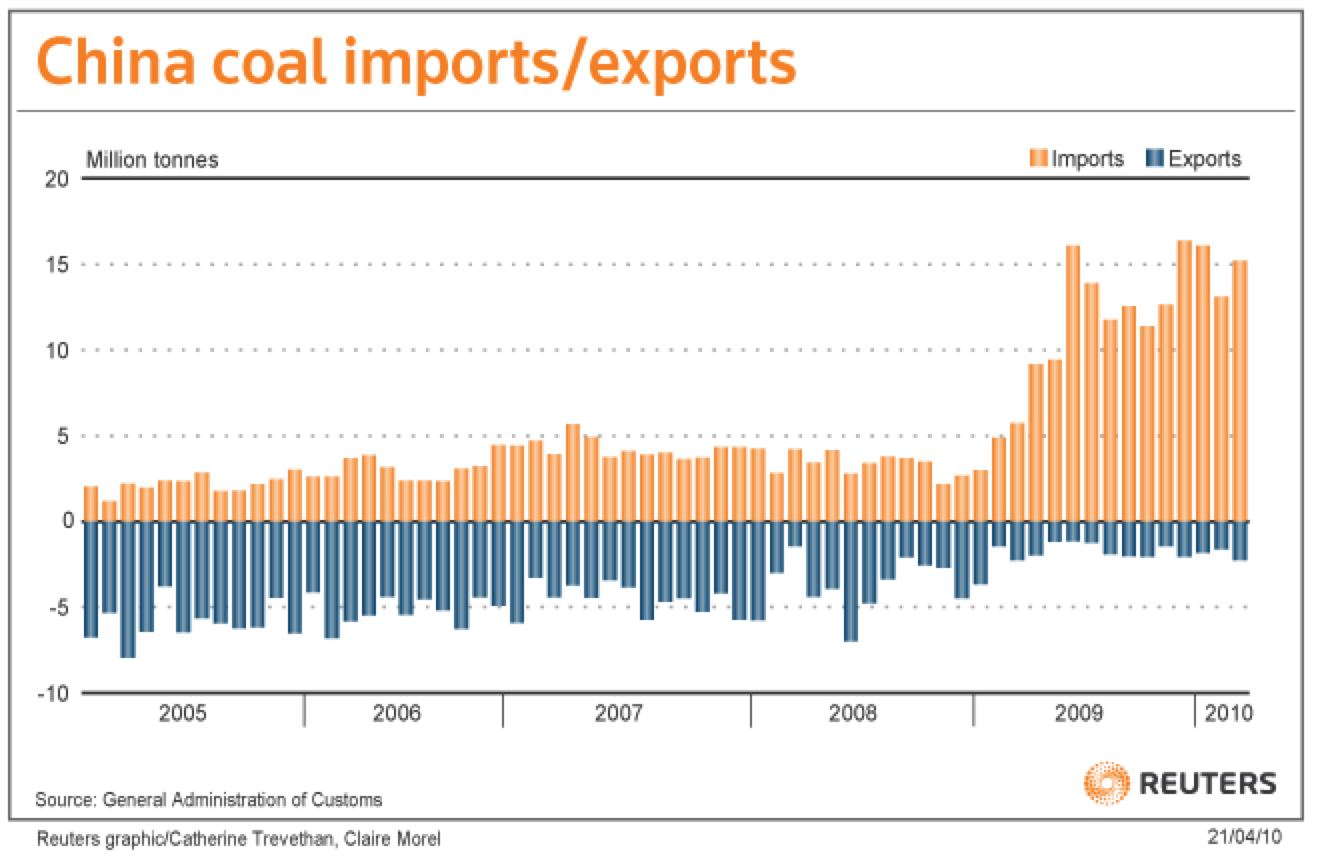
Jean also sent this chart from Reuters showing the gradual decline of Chinese coal exports and the ramping up of imports in 2009.
The shift from China being net coal exporter (2005) to net importer (2009) may have profound impact upon global coal trade. A continuation of the trend towards growing coal imports may create a new spike in global energy prices as China competes for supplies.


