Will uranium supply be adequate for planned nuclear electricity? This question has seen sharply differing views. The purpose of this post is to give an update, showing where we are now.
The supply situation is recently looking better, partly because of an increase in uranium supply from Kazakhstan and partly because of cutbacks in plans for new reactors in response to the Fukushima accident. Reactors are very long-lived, however, and providing sufficient long-term uranium supply when oil supply is declining due to peak oil may be a challenge.
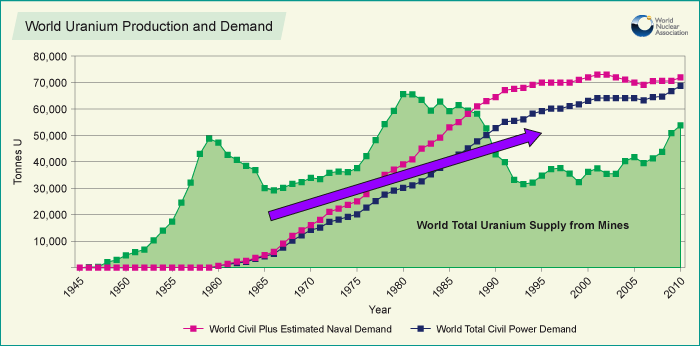
Figure 1. World uranium production and demand (Graph by World Nuclear Association)
Background
Figure 1 shows a history of uranium consumption and uranium mined. The reason that supply from mines can be less than current uses is because some of the supply is from previously mined uranium. Back in the 1950s, 1960s, and 1970s, far more uranium was mined than was needed for peaceful purposes. A large part of this excess uranium was used by both the United States and the Soviet Union to make nuclear bombs. Some of it was stockpiled as well.
Since governments don’t normally give out details relating to strategic materials, not all of the details are known regarding the uranium mined during the early period. For example, we don’t know precisely how much uranium was mined by the Former Soviet Union (Figure 1 shows one estimate), and we don’t know how much excess military inventory Russia has today.
We do know that a large amount of this previously-mined uranium has made its way to the uranium marketplace. Starting in 1994, the Russians entered into a 20 year agreement called Megatons to Megawatts to sell recycled nuclear bomb material to the United States, for use in nuclear power reactors. Since this program is scheduled to end in 2013, one question that has been raised is whether the marketplace will be able to create enough increased production soon enough, to meet the market’s needs.
Several studies were done that came to the conclusion that there likely would be a gap of some kind-too slow ramp up of new mines, or concerns about inadequate reserves, or “peak uranium.” One of these was a study in 2001 by the International Atomic Energy Agency. Another was a study by Energy Watch Group in 2006. The Oil Drum ran a series of four posts by Michael Dittmar in 2009 that also forecast shortages.
Individual commenters have questioned whether these studies were correct. The huge overhang of excess inventory depressed prices. With so much supply flowing into the marketplace from recycled bomb material and other inventory, there wasn’t a need for a great deal of current production. Perhaps the relatively low reserve numbers simply reflected the low prices of the day.
Now that we are getting closer to the 2013 - 2023 date, we can see better what is actually happening in the market place. We know that 2013 - 2023 is not an absolute cut off. Russia may still continue to sell some recycled bomb material, although it will no longer will have an obligation to do so, and the prices will likely be higher. The United States also has a considerable amount of excess inventory that with reprocessing could be used by nuclear reactors. (See 2008 report and 2009 presentation).
We can also see from Figure 1 that for the year 2010, uranium mining is producing 78% of current use-a big improvement over the situation a few years ago. US legislation passed in 2008 placed annual quotas on Russian imports, presumably to try to help markets function more normally.
Uranium Supply and Prices
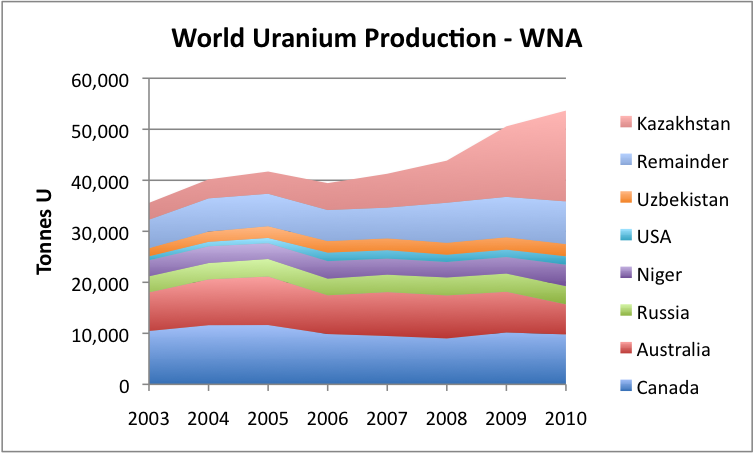
Figure 2. World uranium production by country, based on data of the World Nuclear Association.
Recent uranium production is higher because of increased production from Kazakhstan. Apart from Kazakhstan, production is flat or slightly declining. Kazakhstan claims that it has the ability to eventually ramp up production to 30,000 metric tonnes per year, but indicates that it is planning an output plateau of 20,000 to 25,000 metric tonnes a year. Its production was 17,803 metric tonnes in 2010, so it is not too far from its planned plateau.
If Kazakhstan were the only source of new supply, there would likely still be a gap between demand and current production, because even at 30,000 metric tonnes, Kazakhstan wouldn’t by itself make up the shortfall, although it would come close, if no new reactors are opened. Besides Kazakhstan, there seems to be other new supply planned. From Australia we read:
YELLOWCAKE export out of Port Adelaide is poised to increase almost sevenfold over coming years.
About 5000 tonnes of uranium oxide, or yellowcake, is now shipped out of Port Adelaide, but a combination of new SA mines, the Olympic Dam expansion and new West Australian mines will lift exports to about 37,000 tonnes a year in about 15 years.
So the uranium / nuclear plant balance doesn’t look as bleak as a few years ago. Uranium production is now rising because of supply from Kazakhstan, and more production elsewhere is planned. One thing that is helping supply is higher prices.
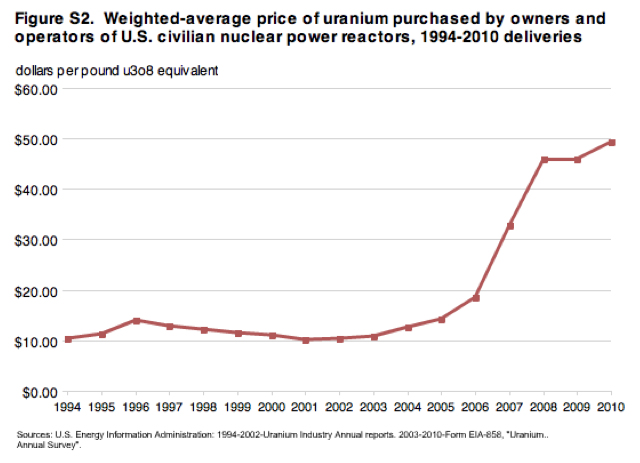
Figure 3. EIA's average price of uranium purchased operators of US nuclear reactors. (EIA Graph)
Prices are clearly substantially higher since 2008, and these higher prices seem to be stimulating supply. (Spot prices are now $54.25, or a little higher than recent average contract prices. Most uranium is sold on long-term contracts.) It takes several years for new mines to ramp up, so some of the higher price effect is not yet being felt.
At its current price, the cost of uranium is only a small share of the price of nuclear electricity. According to the World Nuclear Association, as of March 2011, uranium costs amounted to the equivalent to 0.77 cents per kWh, which is less than one-tenth of the typical sales price of electricity. Because of this, there would seem to be “room” for uranium prices to rise further, without being a major obstacle to electricity sales.
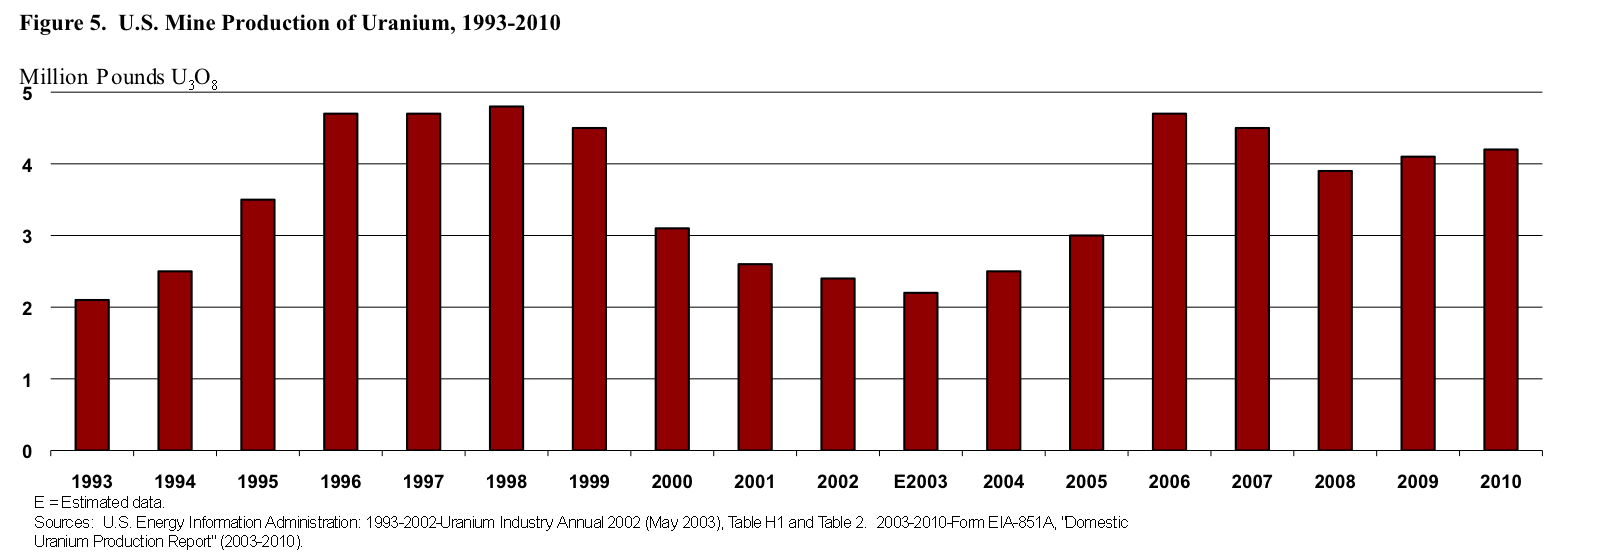
Figure 4. US Uranium Production (Figure by EIA)
In the United States, uranium production has varied (Figure 4). Even at the higher production levels since 2006, uranium production is still very low compared to the amount used by the United States (Figure 5).
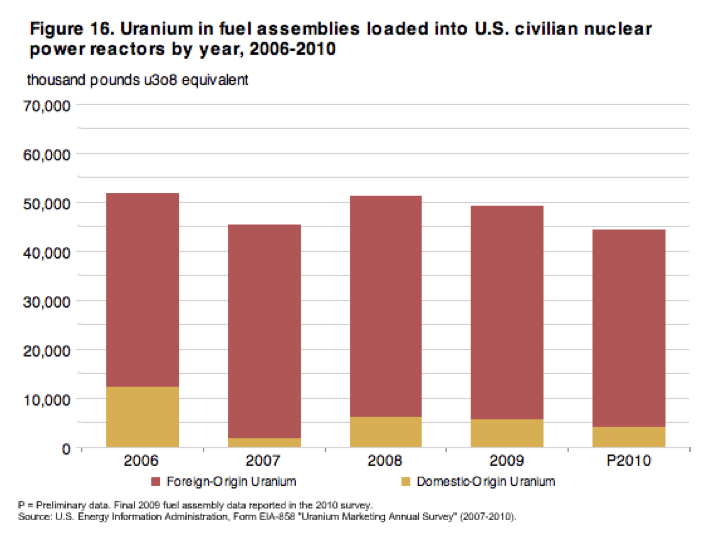
Figure 5. Portion of US Uranium Use from US Sources (EIA Graph)
Demand for Uranium
Clearly, the adequacy of uranium supply depends partly on demand-how many reactors are being built or being taken off-line.
![]()
Figure 6. Nuclear power generation by part of the world, based on BP Statistical Data.
Figure 6 shows that electricity from nuclear power plants grew rapidly in the 1970s and 1980s. The number of new plants tapered off after the Three Mile Island accident in Pennsylvania in 1979, although ones in the planning stages at the time of the accident were still built. Since 2004, nuclear electricity production has been on a bumpy plateau. Because of the lack in growth in nuclear use, there has not been much need for new uranium production, except to offset the longstanding shortfall in uranium mined compared to current use.
Now, following the Fukushima accident in Japan (March 11, 2023), many countries are again rethinking their commitment to nuclear power generation. Germany has closed eight of its older nuclear reactors permanently and is making plans to close the other nine by 2022. A referendum in Italy has rejected a plan to generate 25% of the country’s electrical power from nuclear by 2030. Switzerland has said it will not replace its five nuclear power plants when they reach the ends of their useful lives.
In the absence of changes because of the Fukushima accident, the World Nuclear Association information shows that a large number of nuclear facilities are under construction, planned or proposed. If all of the nuclear power plants that have been proposed are actually built, nuclear generating capacity would more than double from the 2010 level. Just adding the reactors that are under construction or planned would increase world nuclear electricity capacity by 62%.
The countries that are building new capacity include many non-OECD countries. The country with the largest number of planned facilities is China, with 26 reactors under construction, 52 reactors planned, and 120 reactors proposed, for a total of 198 reactors. If all of these were to be built, China would have approximately double the nuclear capacity that the US has today. (The United States is currently the world’s largest producer of nuclear electricity.)
The two countries behind China in adding new reactors are Russia and India. Russia currently has 10 nuclear power plants under construction, 14 planned, and another 30 proposed, making a theoretical total of 54. India has 5 under construction, 18 planned, and 40 proposed, for a theoretical total of 63 new reactors. The list of countries planning new reactors is very long, and includes many from the “Emerging Markets,” including Bangladesh, Pakistan, Turkey, and Vietnam.
What seems likely to happen is that some OECD countries will scale back their nuclear power plans, and even take some off-line, after the Fukushima accident. It is not as clear that the rest of the world will take similar actions. Electricity use has been rising much more rapidly outside the OECD than in the OECD. As a result, many of the countries outside the OECD see a pressing need for new sources of electricity, and few other good options. I would expect that many of these countries will go forward with their nuclear plans if they can figure out the financing to make these plants feasible. They may find ways to cut corners (like putting them next to the ocean, with once-through cooling with sea water) to keep costs down. If planning is not good enough, short-cuts can raise accident possibilities, though.
We will have to wait and see how this all works out, in terms of implications for needed nuclear fuel. The situation doesn’t look as bleak as it did a few years ago because of new uranium sources, but adequate supply is not entirely a “done deal” either. In their 2001 study, “Analysis of Uranium Supply to 2050,” the International Atomic Energy Agency (IAEA) showed the graph I show as Figure 7 as their forecast of future uranium production. (The IEAE is now saying Latest Data Shows Long-Term Security of Uranium Supply, so it has backed off from the 2001 assessment shown in Figure 7.)
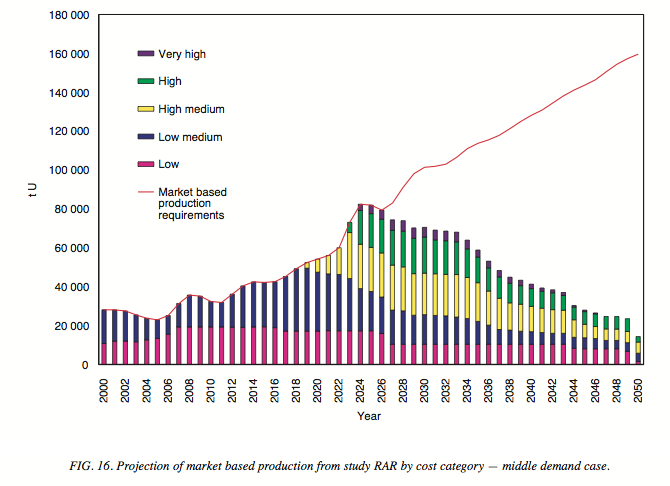
Figure 7. IEAE Uranium Supply Forecast from "Analysis of Uranium Supply to 2050"
Figure 7 shows the shape of curve a person would expect uranium supply to have-rising to a peak, and then declining, since it is a finite resource, like oil, or like copper. New sources of uranium supply will be helpful, but eventually mines will begin to deplete, and we will be faced with finding new sources. Instead of talking about finding “new Saudi Arabias of oil,” we may someday talk about the need for “new Kazakhstans of uranium.”
Besides finding additional uranium supply, there may be other “work arounds.” With nuclear energy, there is at least the possibility of reprocessing spent fuel, but suitable reprocessing facilities need to be built in advance, if this is the plan. There is also the possibility of thorium being used in some of the yet-to-be-built reactors, if the details of making thorium work can be figured out.
One question those building nuclear plants should be thinking about is, “What impact will peak oil have on uranium availability?” Theoretically, uranium production can go on as before, if there is sufficient oil for essential services (extracting the uranium, maintaining the roads, raising the food that the workers need to eat, and transporting the uranium to where it is used, for example). Whether or not this whole process can go on for the 50 or 60 year lifetime of reactors now being built is an open question. Adequate oil supply will also be needed during the period of decommissioning, and for servicing spent fuel, after the reactors close.
Previous Estimates
Back in 2009, Michael Dittmar and Brian Wang made a bet regarding how world uranium production would progress and how nuclear power generation would progress, with Michael Dittmar betting on the low side, and Brian Wang betting on the high side.
For the year 2010, it looks as though Brian Wang won both bets. Brian Wang bet that uranium production would be above 50,500 metric tonnes. World uranium production was 53,663 metric tonnes, so Brian was the winner.
With respect to electricity generated from nuclear energy, the dividing line between the two bets was 2,630 billion kWe. Actual generation was 2767 billion kWe according to BP’s Statistical Review of World Energy, so again Brian is the winner.
There is no actual money changing hands with respect to this bet. The only prize I remember hearing about was a possible bottle of wine for me.
This article originally appeared on Our Finite World.


![]()